


 Url copied to clipboard.

If you are a regular Timeform reader, you should have an idea of what sectional timing is already. It involves the breaking down of a horse’s overall time into the sections which gave rise to it, resulting in a far fuller picture of how a horse’s performance came to be, and of how efficiently or inefficiently the horse ran.
Unfortunately, electronic sectionals have appeared only sporadically in Britain and Ireland over the years, though the indications are that this may change before long. As a result, sectional-timing analysis can be labour-intensive and remains something of a niche concern in Britain compared to many other major racing jurisdictions.
Not to fear, though, as Timeform has taken a lot of the “grunt” out of this aspect of analysis in recent years by sourcing a large amount of sectionals through advanced video analysis. The findings appear in the subscription-only Timeform Sectional Archives, and this now covers both a considerable period of time and the vast majority of courses in both Britain and Ireland.
The Timeform Sectional Archives were more recently augmented with “upgrades” for individual horses, in line with the methodology explained in “Sectional Timing: An Introduction by Timeform”, so that horses who have “done well” or “been flattered” in sectional terms can be identified quickly.
Plenty of customers, as well as this writer, take sectional times into account in their betting as a matter of course these days.
The Archives also include a vast amount of information about how races tend to be run, and won, which will be invaluable to in-play bettors and others, and which have yet to be taken fully into account by the markets.
This short series of blogs will identify a few of these features from the multitude which exist, starting with turf Flat racing, using the Timeform Sectional Archive for 2016 until the end of July.
First off, however, some of the obstacles to analysis need to be acknowledged. Among these are the fact that sectional distances – which are individually established and spelt out in the Archive – may vary according to circumstance. Camerawork may be what dictates that one sectional is preferred over another, but the majority used are the last-three furlongs of races (accounting for 67.5% of the over 20,000 individual entries).
Among other things we can establish are the average margins back from the leaders, at the various sectionals, of race winners for the entire Archive, as follows:
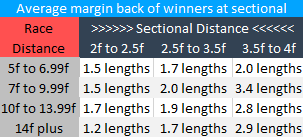
On average, winners are a length or two back from the leaders at the sectional, unless the sectional used is 3.5f or longer (in which case, winners tend to be further back), and, interestingly, that varies little by overall race distance.
More informative still are the %s of horses who were in the lead at the sectional and went on to win:
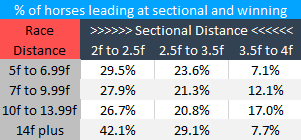
One thing that can be seen here is that the incidence of horses leading at the sectional and going on to win increases greatly once the sectional used drops below 3.5f, especially at extremes of distance. A 4f sectional tends to be too early in a sprint race to tell you much, while, at the opposite end of the spectrum, 2f from home is much later in a staying race in proportion to a race’s overall distance.
If you knew nothing else, you would treat a horse leading after 3.5f out more positively than one leading before then, and you would expect an even later leader in a staying race to outperform the same at shorter distances.
One important consideration is, of course, field size. The likelihood of leading at the sectional and still leading at the line will be strongly related to how many rivals a horse has. The following table gives the impact values for the same categories: that is, the factor by which horses leading at the sectional won compared to chance.
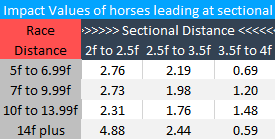
So, the likelihood of a horse leading and going on to win is around double that of chance at the 3f marker but between 2.3 and 4.9 times chance if the horse is leading at the 2f marker instead. The former does not vary greatly with overall race distance, but the latter does. “Double that of chance” would be a 20% probability of winning in a 10-runner race, for example.
Those are the figures for all turf Flat races in the Timeform Sectional Archive, and are the kinds of benchmarks in-play bettors should either be aware of or understand instinctively. However, the figures will vary by-course, and some.
Taking all course-and-distance categories in which more than 10 races have been run since the beginning of the year, some interesting differences become apparent. The following are among the more notable findings:
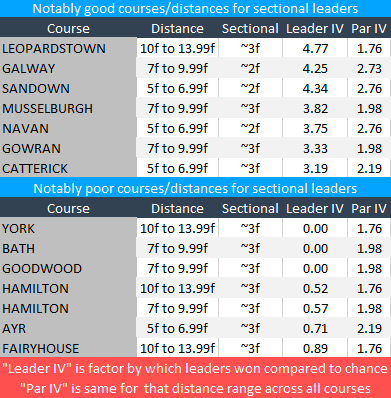
Not one horse leading at the sectional (approximately 3f out) won at Goodwood 7f to 9.99f (26 races), York 10f to 13.99f (19 races) or Bath 7f to 9.99f (12 races) in the period under review, despite an expectation that around twice chance would occur.
All 14 races at 7f to 9.99f at Naas did not go to the leader at the sectional (a variety of sectional distances had to be used, which is why it does not show in the table). The impact values for Newbury were low at all distances, with a 4f sectional most often in use at the course due to camerawork.
At the other end of the scale, those figures for 10f to 13.99f at Leopardstown, 7f to 9.99f at Galway and 5f to 6.99f (in reality, 5f) at Sandown are remarkably high, with horses which led at the sectional winning more than four times as often as chance.
The figures for Catterick and, to a lesser degree, Chepstow and Pontefract are high for all distances short of 10f: leaders at the sectional at those courses tend not to come back.
A knowledge of the individual horses concerned, not to mention an appreciation of the pace at which the race in question has been run (though that remains very difficult to establish without live and on-screen sectionals), is important. But that plays out against the background of the courses and distances, and the habits of jockeys, themselves.
Establishing the general effect of those courses and distances is just one of the many things that a manipulation and interrogation of the Timeform Sectional Archives enables. Forthcoming blogs will look at other angles, as they apply to jumps racing and Flat all-weather racing.


.jpg&w=300)
.png&w=300)