


 Url copied to clipboard.

There’s often a lot spoken about the effect of the draw for the Oaks and Derby, and on social media this week that has once again been the case. It’s no secret that stalls 1 and 2 have a poor recent record in the two races, but is that a statistical blip, or something to take heed of?
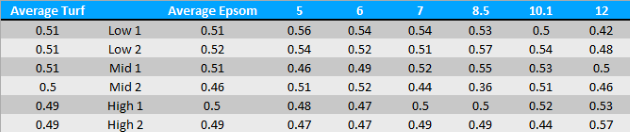
The graph below shows the effect of the draw for all handicaps of six runners or more at Epsom since April 2011 (when draw information was reclassified at certain tracks), with the field split into six groups. The figures displayed are the percentage of rivals beaten by each group, this method favoured for comparison as it reflects the performance of the whole field, rather than just winning horses.

A figure of 0.50 rivals beaten suggests there would be little to no draw bias, and judging Epsom at all distances (red line) it shows that low draws hold a slight advantage over those drawn very high, however it stretches to a more considerable one over those drawn middle to high who are at a more significant disadvantage.
However, when assessing just the Derby C&D (blue line), this advantage turns on its head, with low draws beating less than par, and high draws performing better than par.
Now this isn’t to say that low draws cannot win. Day in, day out, horses are able to overcome such disadvantages for any number of reasons, but it’s worth bearing in mind that when the stalls open at around 4.30pm on Friday and Saturday afternoon for the third and fourth classics of the year, they aren’t necessarily emerging to a level playing field.
For those interested in the effect of the draw split by distance in more detail, the following table might be of interest.

.jpg&w=300)
.png&w=300)